At last:
an instrument that
reads
drag!
A veteran soaring investigator
develops a
system that measures how much drag your
wing is creating, and displays the changes
by RICHARD H. JOHNSON
|
|
Flight test measurements of the performance of modern sail planes have shown that highly laminar wing airfoils often are subject to separation bubbles on both the up per and lower wing surfaces. These airflow separations significantly in crease wing drag, and if they appear abruptly with airspeed, they some times show on the polar test data as higher drag discontinuities or "knees" in what would otherwise be a smooth polar curve. On other occasions a bi-stable drag phenomena has been observed, where at a given airspeed and flap setting the sailplane can cruise steadily in still air and exhibit either a low drag sink rate, or a repeatably higher drag sink rate.
There are no discernible vibrations or other clues for the pilot to recognize, because the wing airflows are outwardly quiet and subtle. Only variations in sailplane sink rate are apparent to the pilot, and those are essentially masked during most soaring flight by vertical movements of the air. When a pilot needs to maximize his sailplane's performance, he can do it only by optimizing airspeeds and flap settings, and by avoiding high-drag flow separation and premature turbulent transitions.
It is not really possible for even an expert pilot to achieve a sailplane's full performance potential unless he has some reliable instrumentation in the cockpit that will display information about his aerodynamic drag level. The wing profile drag is the largest variable over which the pilot has some control, except for induced drag which the pilot controls principally through airspeed, g's and gross weight.
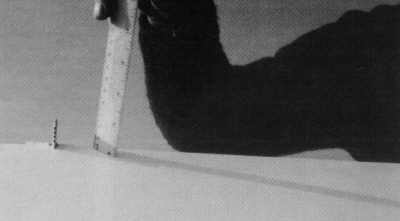
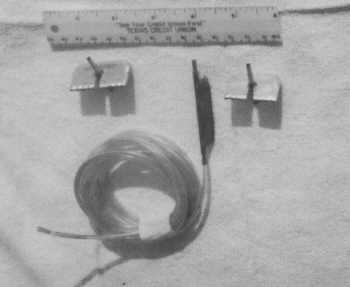
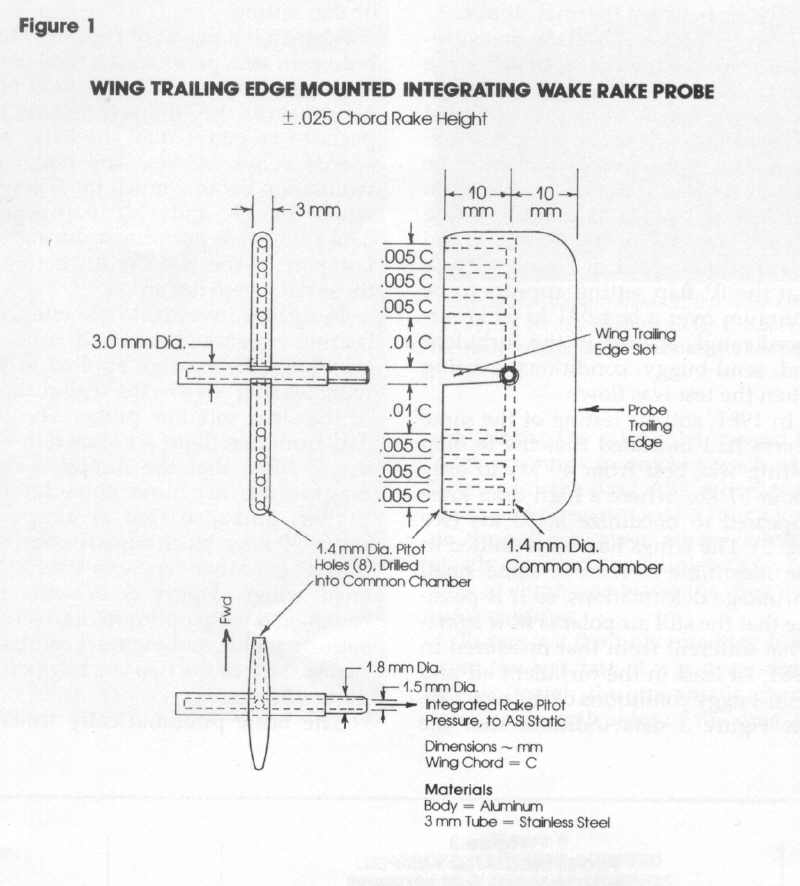
It is relatively easy to make real time wing profile drag measurements and to display these in a relative fashion to the pilot. The profile drag of any wing manifests itself as a momentum loss in the wing boundary layer airflow, and that can be measured by a probe mounted on the wing trailing edge. A large number of probe configurations was flight tested during the development of this concept. The configuration deemed to function best is shown in Figure 1.(Rake Construction Page Link)
It is an eight-pitot integrating rake design that essentially averages pneumatically the pressures of eight pitot heads and transmits the averaged pressure to the cockpit indicator via a relatively long 1.5 mm (.062 inches) internal diameter plastic tube. This probe was purposely made small, thin and light so that aerodynamic drag would be small, and for the cases where it is to be mounted on a wing flap, its mass unbalancing effect will be minimized. Caution must be exercised when mounting the probe on any hinged surface that is critical in regard to flutter, because even relatively small mass unbalancings can lead to a lowered flutter onset airspeed. Manufacturer's handbook balancing requirements must be observed in any case.
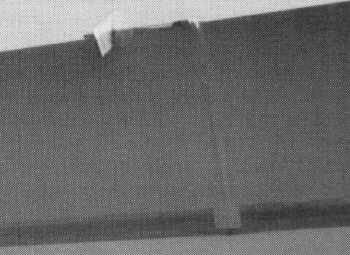
The dimensions given in Figure 1 for pitot hole spacing are expressed as fractions of the wing chord length at the span wise location where the probe is to be mounted. Since normally only one probe will be mounted on the sailplane wing, it should be installed where it will best represent the whole wing. The test Ventus A used a location 1.22 m (48 inches) outboard of the left fuselage side, where the wing chord is 762 mm (30 inches). The recommended probe height covers 2.5 per cent of the wing chord, both above and below the wing surface. Lesser heights were tested with satisfactory results, except that they tended to miss a part of the boundary layer when the flaps were grossly miss-set, and therefore caused the system to indicate less drag than it should. No pitot holes are needed at the + or - 0.5 per cent heights because that is deep within the wing's boundary layer, and little can be done to significantly change the sluggish airflow encountered there.
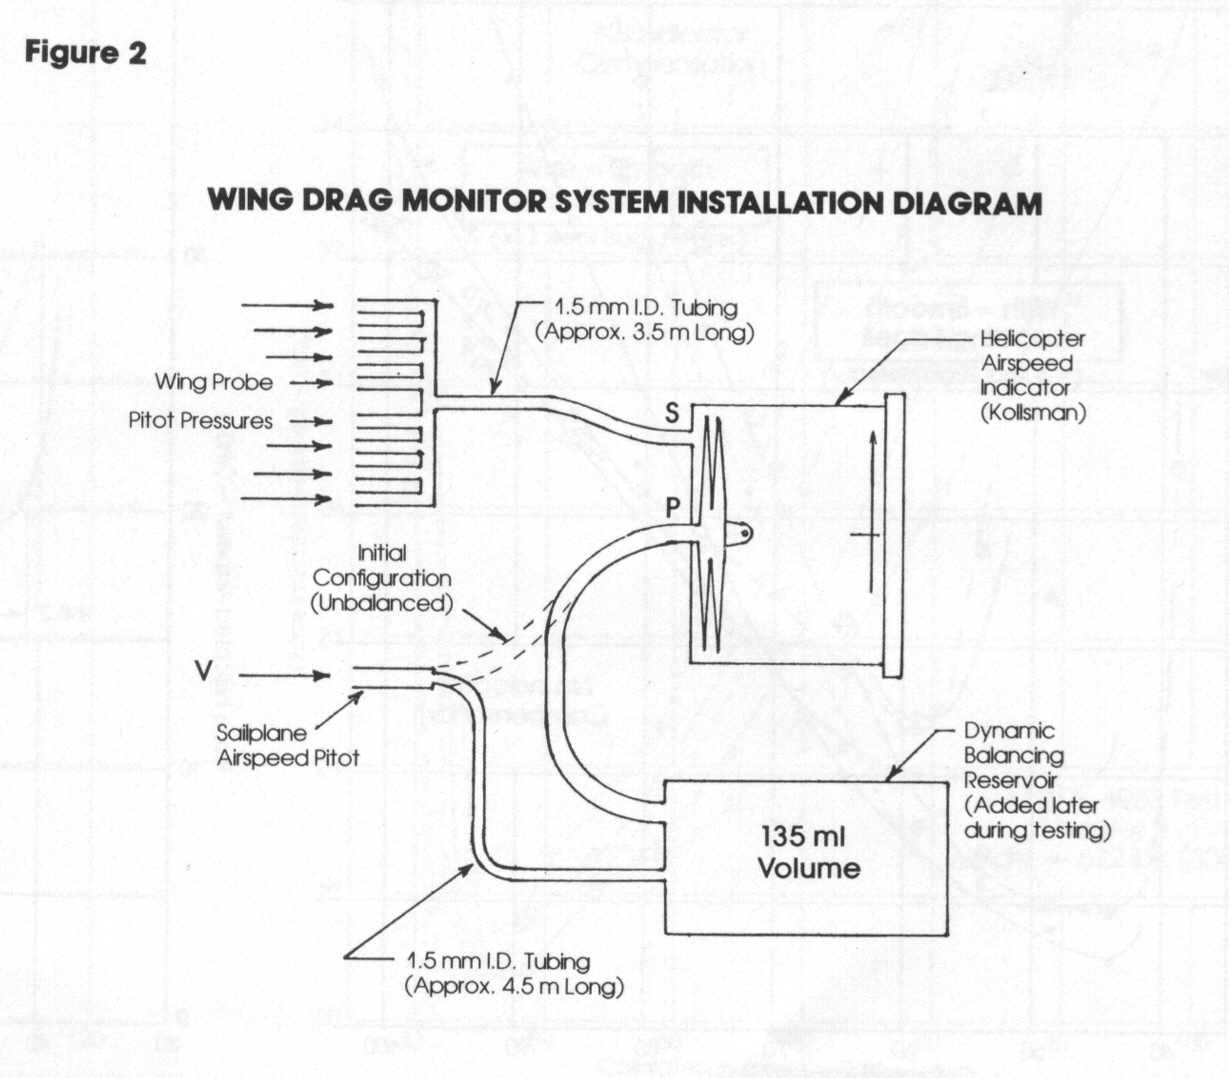
Figure 2 is an installation schematic diagram, showing the wing probe pressure tube connected to the static side of a sensitive helicopter airspeed indicator, mounted in the sailplane cockpit. The pitot side of this sensitive ASI is connected to the sailplane's normal ASI pitot line, which should provide full free stream total pressure to the pitot inlets of both the sailplane's normal ASI and the drag measuring ASI described here.
Conventional airspeed indicators are differential pressure gauges that measure the difference between pitot and static pressures. By substituting the wing drag probe pitot pressure for the drag-measuring ASI's static pressure, one obtains a qualitative measure of the wing profile drag at the probe chord station. Because of the type of indicator used here, the wing drag is expressed in units of airspeed, which is quite satisfactory for the intended use of a relative drag indicator.
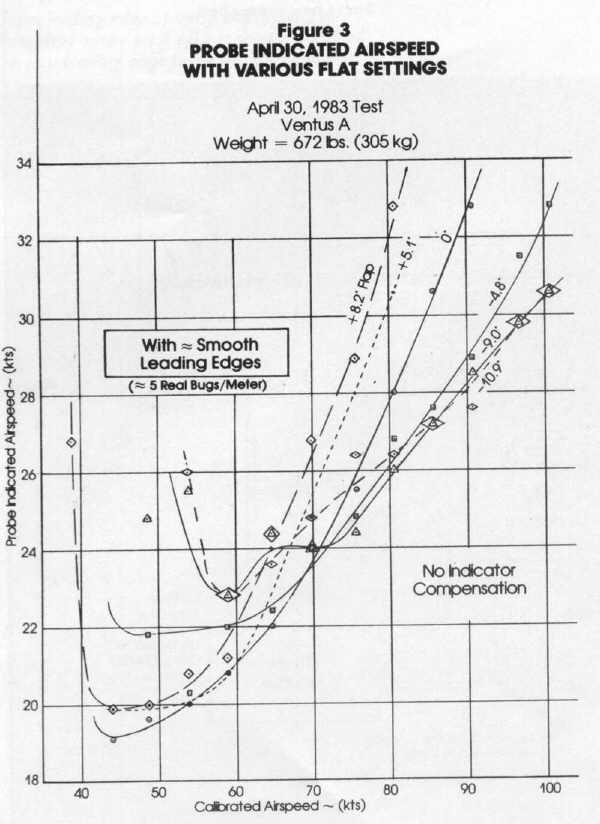
To keep the initial test installation as simple as possible, it did not include the dynamic pressure balancing reservoir and matching pitot flow restriction shown in the lower portion of Figure 2. Typical flight test data taken in the Spring of 1983 with this instrumentation configuration are shown in Figures 3 and 4, where the measurements were made in moderately turbulent air between thermal climbs.
 During
Figure 3's data measurement runs, relatively
few insects were encountered. The drag probe readings are shown versus sailplane
calibrated airspeed for each of six wing flap settings. The probe system appears
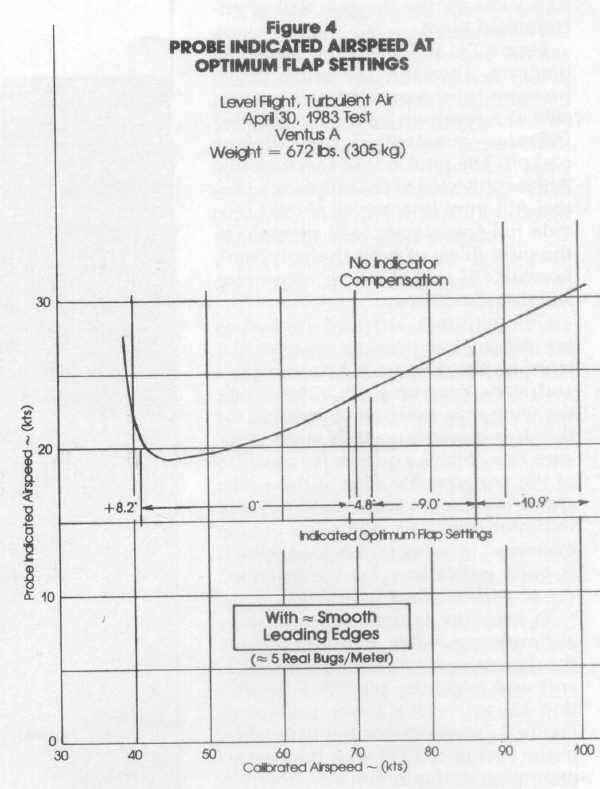
to be an excellent indicator of the optimum flap setting needed to minimize
drag at each test CAS of the Ventus A, and this is summarized in Figure
4. Note that the 0° flap setting appears to be optimum over a large 41
to 69 kt airspeed range, at least in the turbulent and semi-buggy conditions
existing when the test was flown.
During
Figure 3's data measurement runs, relatively
few insects were encountered. The drag probe readings are shown versus sailplane
calibrated airspeed for each of six wing flap settings. The probe system appears
to be an excellent indicator of the optimum flap setting needed to minimize
drag at each test CAS of the Ventus A, and this is summarized in Figure
4. Note that the 0° flap setting appears to be optimum over a large 41
to 69 kt airspeed range, at least in the turbulent and semi-buggy conditions
existing when the test was flown.
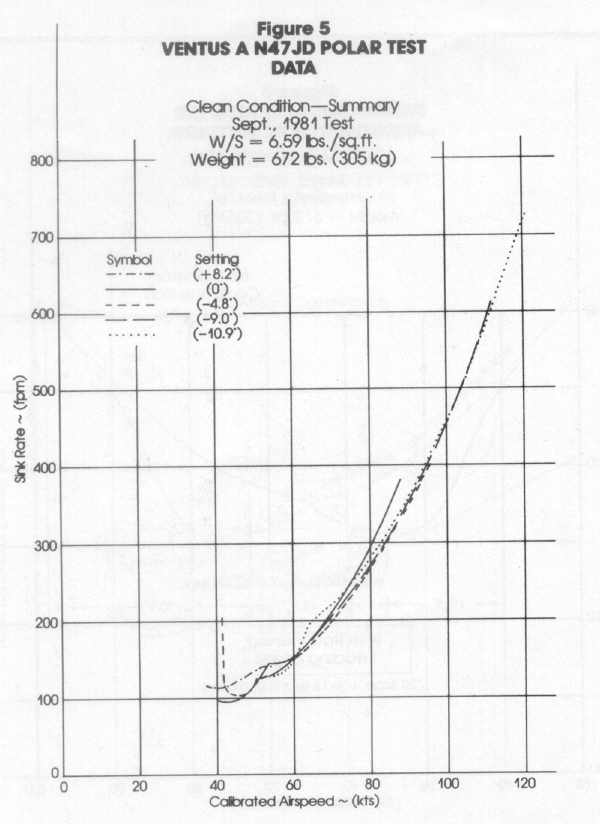
In 1981, still-air testing of the same Ventus had indicated that the 0° flap setting was best from 40 kts to only about 51 kts, where a high drag knee appeared to maximize at 53 kts (see Fig. 5). The wings had been sanded in the meantime to remove some small shrinkage deformations, so it is possible that the still air polar is now somewhat different from that measured in 1981. At least in the turbulent air and semi-buggy conditions of the new test, the Figure 3 data indicates that the high drag knee does not exist with the 0° flap setting.
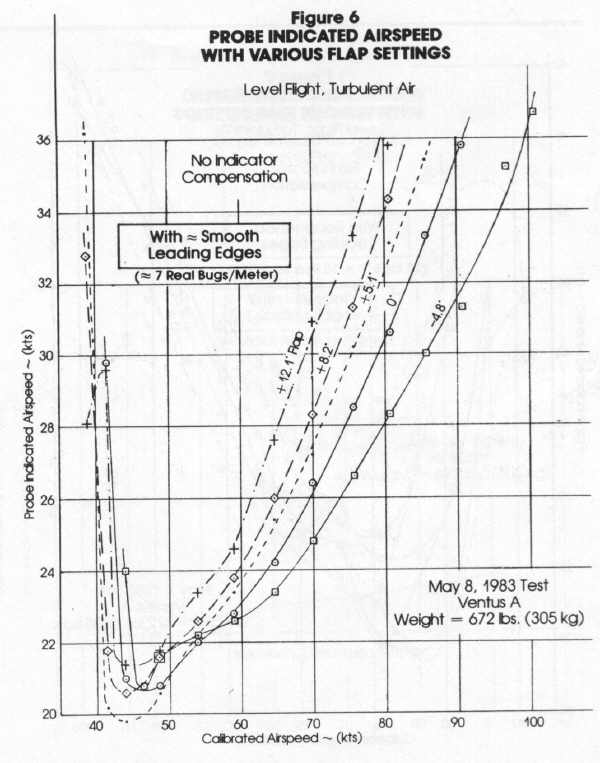
Figure 6 is a repeat of Figure 3's turbulent air test, performed a week later in slightly more buggy conditions. Note that the +5° flap setting now appears to be better than the 0° at airspeeds below 50 kts. The bug contamination became much more severe when the -9° and -11° flap setting data runs were performed during the last part of the test flight; therefore, those data were discarded.
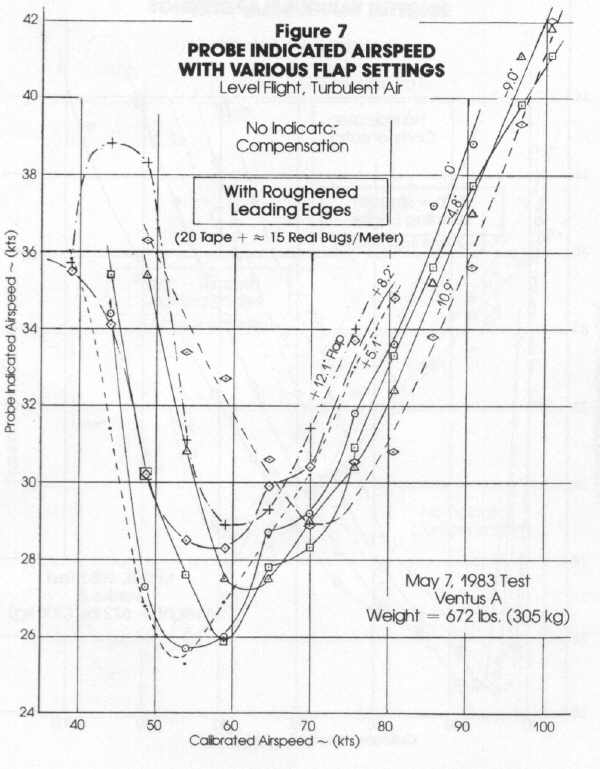
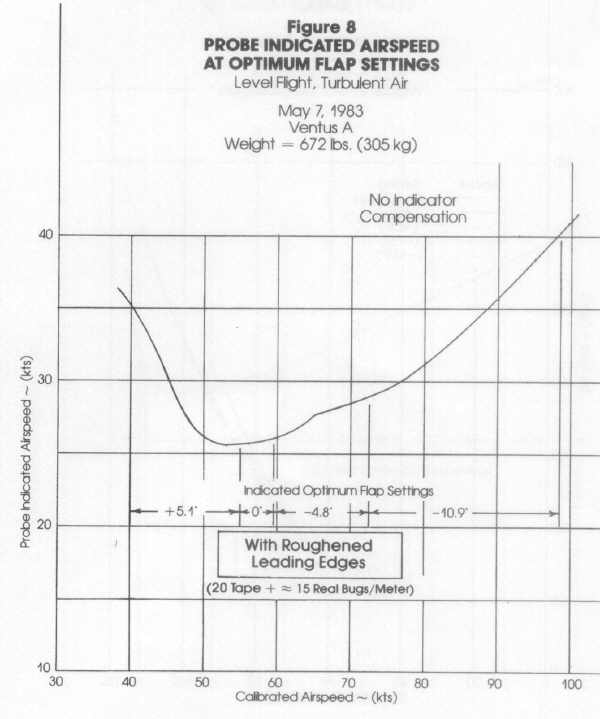
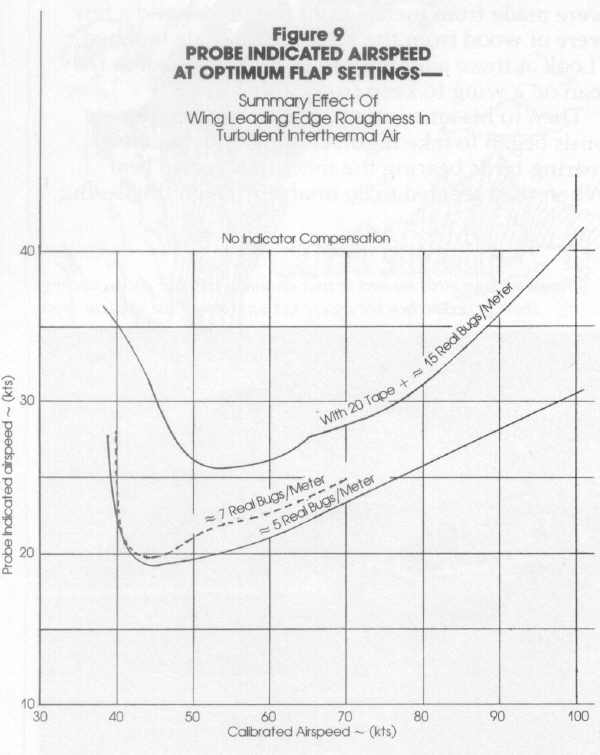
To further investigate the effects of leading edge roughening, 20 artificial tape bugs/meter were applied to the wing leading edge in the region ahead of the drag monitor probe. The test data from that flight are shown in Figure 7. Note that the indicated drag magnitudes are now considerably higher, and also that at airspeeds above 50 kts a more negative flap setting is better than it is with less roughened wings. Figure 8 presents the roughened wing optimum flap setting summary plot, and Figure 9 compares that to those of the two less buggy tests discussed earlier.
The basic pneumatically uncompensated drag monitor system performed its intended function well as long as steady flight was maintained. However, when dives and thermal entry pull-ups were performed, unwanted pressure lag effects distorted the indicated drag values. A pull-up into a strong thermal would cause the drag indicator to read about five knots less than it should, whereas a departing dive would have the opposite effect. Also, steady climbs on tow or in thermals would cause lowered drag indicator readings that erred approximately in proportion to climb rate, and vice versa for descending glides.
|
|
The unwanted pneumatic lag effect was caused by the relatively long length of small 1.5 mm (.062 inch) ID tubing that joined the wing-mounted probe to the static side of the drag ASI. That alone would not be very significant except that the static sides of practically all ASI's contain a surprisingly large internal air volume, and the pitot sides contain a much smaller internal volume because they lead directly into relatively small pressure-sensitive bellows. This, plus the short length of low resistance 5 mm (.20 inch) ID tubing joining the pitot inlet, caused the pitot pressures to quickly reach equilibrium in the drag ASI, whereas the static side pressures took a much longer time. Thus even when flying at steady airspeed, the sailplane's vertical sink or climb rate biases the drag indicator readings.
To remove the unwanted lag biases from the test data, it was necessary to evenly match the pneumatic characteristics on both sides of the drag ASI system. This was accomplished by adding a 135 ml reservoir to the pitot side, as shown in Figure 1, so that the internal volumes are equal, and then adding an equivalent length of small diameter restrictor tubing between the pitot pressure source and the reservoir. Now a pressure change encountered simultaneously at both the drag pitot and the sailplane ASI pitot will arrive inside the drag ASI at equal rates and will thus be dynamically balanced for vertical speed errors. This can be checked by placing both the connected drag probe and the pitot inlet line inside a common sealed jar, then applying light pressure changes via an additional small tube leading from one's mouth into the jar. When properly balanced, plus and minus pressure changes will cause essentially no movement of the drag ASI from its zero reading.
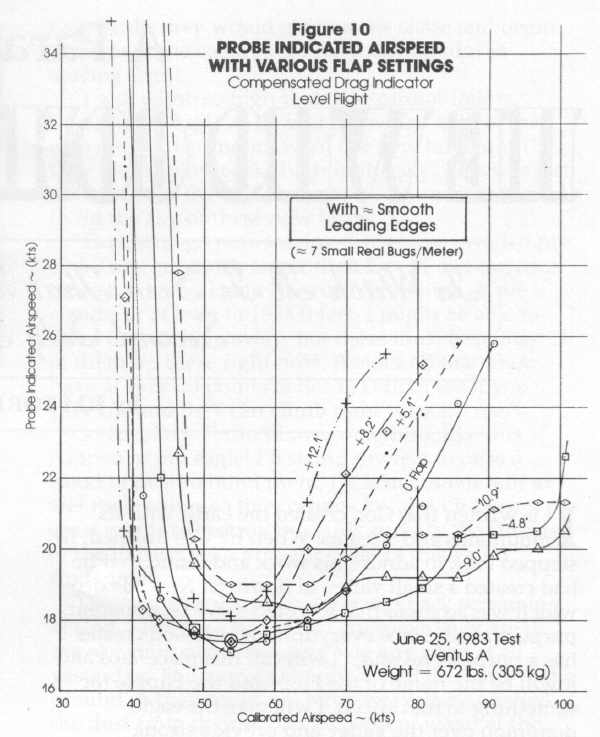
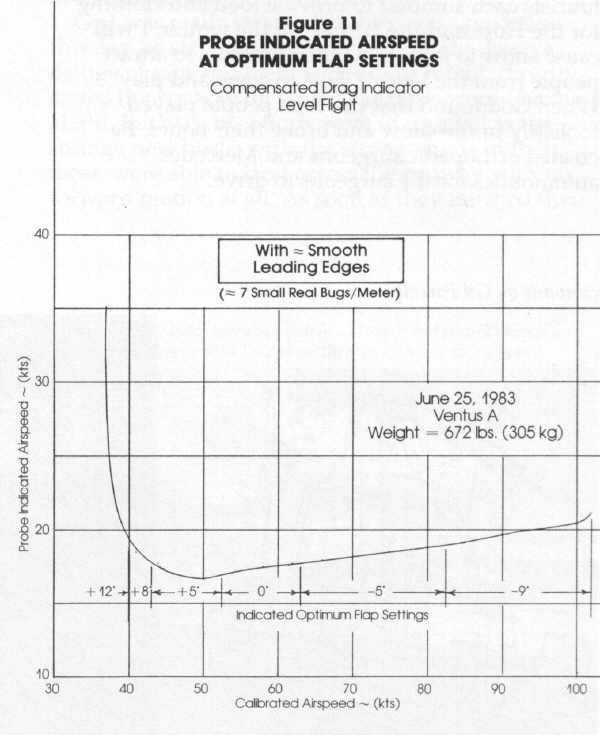
Thus compensated, the drag indicator system was again test flown on June 25, 1983. True to expectation, the drag indicator showed lowered probe IAS values during data runs between thermals and demonstrated that it was not affected by climbs and dives. The steady-flight probe drag data measured during that flight are shown in Figure 10. These data are averaged values from three separate data runs performed during a single high tow flight.
The first run was performed in still smooth air with the wing leading edges clean and smooth. After that, thermaling flight was initiated and probe drag readings were twice made in turbulent air between thermals. A number of small insects stuck to the wing leading edge ahead of the probe during the thermaling and turbulent air data runs. Surprisingly, the indicated drag values measured in the turbulent air and with slightly buggy leading edges were essentially identical to those measured in smooth air with a completely clean wing. For that reason the data from that test flight were averaged for the Figure 10 plot.
Figure 11 shows the probe indicated airspeed when the best flap setting is used at all sailplane airspeeds tested. Also shown are the best flap settings versus sailplane airspeed. Note that only a slight drag knee is shown at 55 kts. Additionally the full negative -11 0 flap setting did not appear to be optimum at even the maximum test airspeed of 101 kts. Indeed the earlier still air sink rate test data shown in Figure 5 indicated that the -11 0 flap setting was better only above 105 kts.
In summary, the wing profile drag monitor system performs well even when uncompensated pneumatically for lag effects. Useful information is readily available to the pilot on a real time basis as to which flap settings produce the least drag, with any degree of wing roughening due to bugs, dirt or rain. The system also is useful when thermaling because it tells the pilot immediately when a tightened turn drives the wing out of its low drag laminar bucket, or when a better flap setting is achieved. If the sailplane has a bi-stable polar region, the probe can promptly inform the pilot at which drag level he is flying.
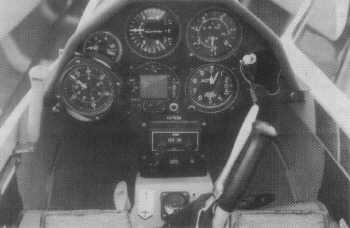 Instrument at bottom left is helicopter ASI temporarily mounted in Ventus to serve as an indicator of relative wing profile drag. |
Better probe performance occurs when the system is pneumatically compensated, and this is easily accomplished. New sensitive digital electric airspeed indicators with extremely small internal volumes are now becoming available, and one of these is scheduled to be tested in the Ventus soon. Likely little or no compensation will be needed with the electronic drag ASI because of its inherently small internal volume. Possibly an even smaller connecting tube can be used there without detrimental effects. Also, much less space will be required to mount the electronic ASI in the cockpit because its integrated electronics and thin liquid crystal display are much more compact than those of a standard mechanical indicator.
Thanks are due the Dallas Gliding Association and its members and friends who supported this drag probe development and testing.
Transcribed from Soaring - October 1983